





1 · Pick the tyre
EU wet grip grade A to E, tread depth, age and type. The grade is printed on the label of every new tyre sold in Europe.
2 · Pick the conditions
Weather from dry to flooded, 25 road surfaces, temperature and slope.
3 · Drive it, or script it
Hold ACCELERATE and brake yourself, with a foot-down slider and a hold-speed lock, or fill in the run sentence and watch it play out. Every stage lands in the run log.
4 · Compare
After any stop, pick a what-if: grade, wear, weather or terrain. A second road appears and the same drive plays out on both. Only the braking changes, never the build-up.
Start hereHow to use it
The simulator answers one question: from this speed, in these conditions, on these tyres, where does the car stop. Every setting sits on one screen across three tabs. Pick the tyre and the conditions, watch the live estimate under the grid, then press START TEST.
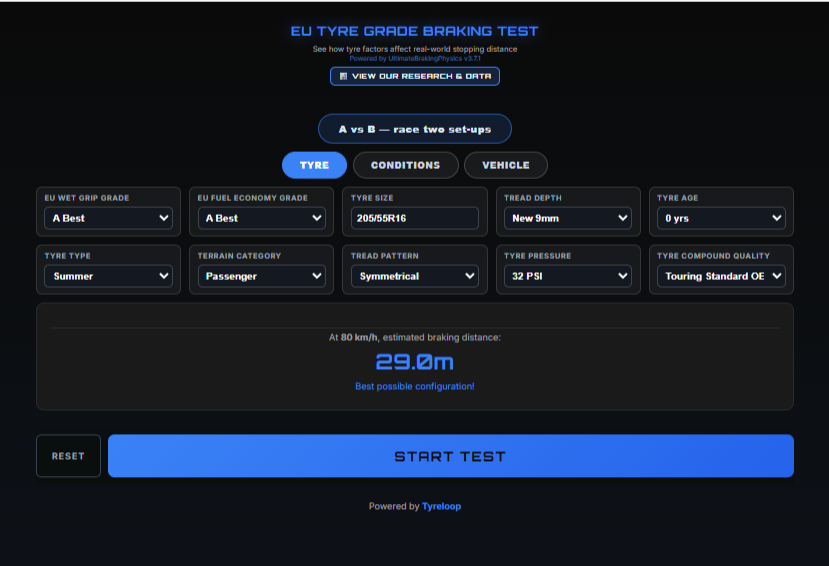
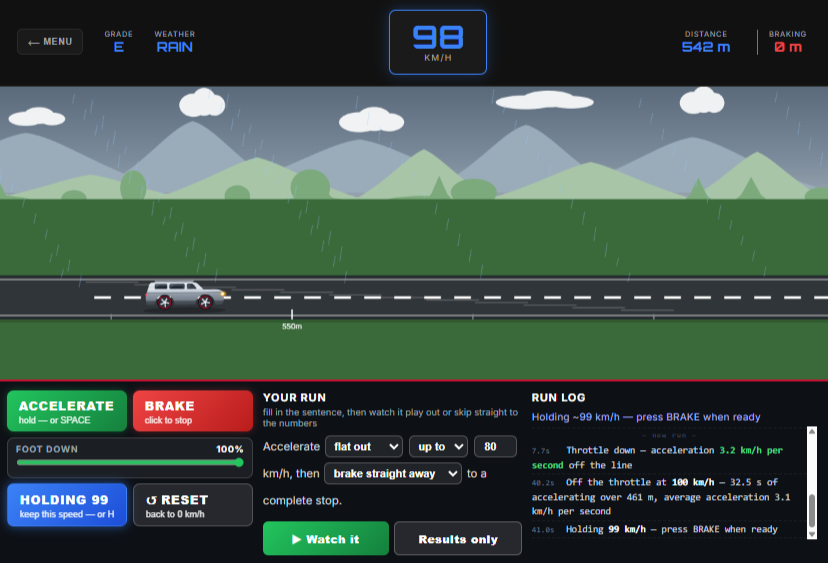
There are two ways to drive it. Yourself: hold ACCELERATE (the foot-down slider sets how hard you press), lock the speed you want with HOLD SPEED, then hit BRAKE. Or script it: fill in the run sentence, accelerate flat out up to 80 km/h then brake straight away, and press Watch it. Results only skips the animation and goes straight to the numbers.
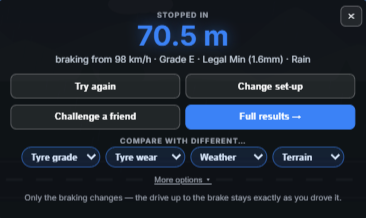
When the car stops, a small card shows the distance and everything you can do next, including the compare menus.
Compare: the question everyone actually has
You stopped in time. Would you have stopped on worn tyres? Pick it from the card and a second road appears above yours. The same drive plays out on both, and the cars split only when the brakes go on. The comparison starts at the brake: your speed, your brake point and your driving stay exactly as you drove them, and only the braking physics change. Rain compares against dry from the same speed, which is the honest way round.
A vs B: race two whole set-ups
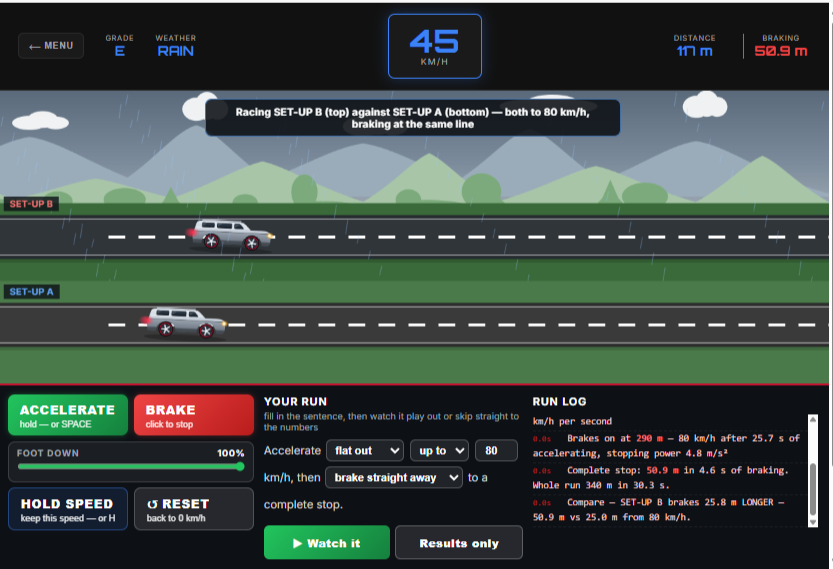
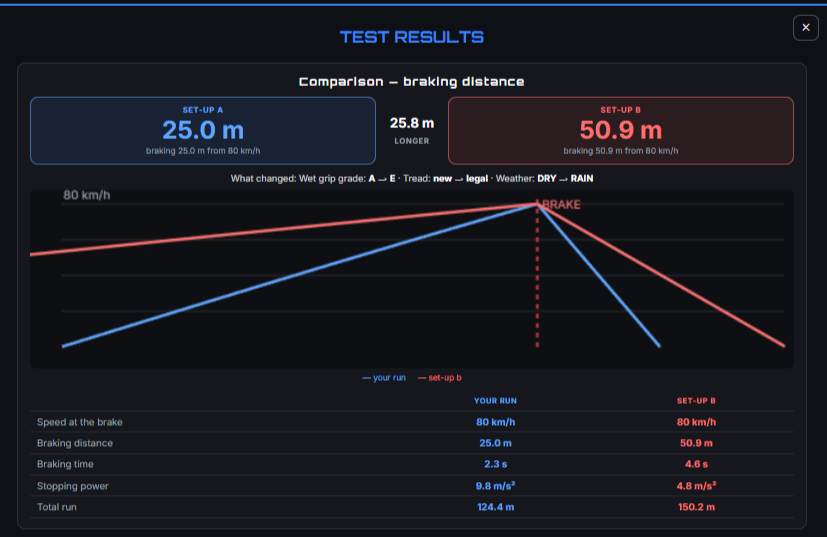
On the setup screen, press A vs B to lock your current settings in as set-up A. Change anything you like, then press it again. Both set-ups accelerate to 80 km/h in their own conditions and brake at the same line, so the gap you see on the road is the gap between the set-ups.
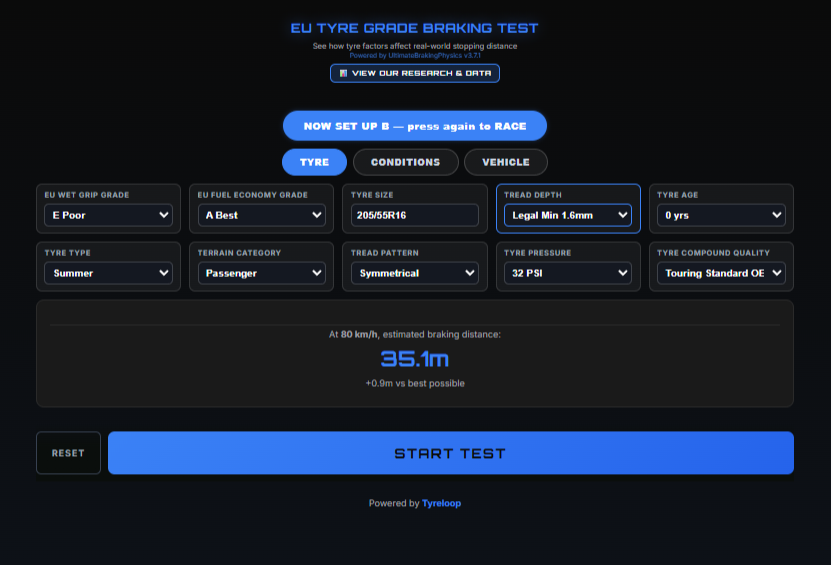
The way to learn from it is to change one thing at a time, and the compare menus do exactly that in one pick:
- Test your own tyre first. Set the grade from your tyre's EU label, the tread from a depth gauge (or our tread gallery if you are estimating by eye), and the age from the DOT date code.
- Then bald it. Run in the rain, then compare with tread at the legal minimum. From 80 km/h that one change stretches wet braking from 35 to 51 metres. That gap is what the tread you still have is worth.
- Then cheapen it. Compare grade E against A: 31 metres becomes 43 in the wet. That gap is what the wet grip grade is worth, and it is usually more than the price difference between the tyres.
- Comparisons stay like for like because they always start from your brake point at your speed. Two separate runs braked from different speeds are not comparable numbers; the built-in compare never has that problem.
The controlsWhat each setting does
Every control changes the physics, not a difficulty slider. What they do, with the engine's own numbers where one change tells the story:
The tyre
- EU wet grip grade (A to E): the tyre's measured wet braking class from its label. A to E at 80 km/h in the wet: 31 metres becomes 43.
- Fuel efficiency grade (A to E): rolling resistance. Barely touches braking; it changes how far the car rolls when you lift off.
- Tread depth (8 mm to bald): how much water the grooves can clear. New to the 1.5 mm legal minimum adds 46% to wet braking. In the dry it hardly matters, which is why worn tyres feel fine right up until it rains.
- Tyre age (0 to 10+ years): rubber hardens and grips less. Ten years adds 23% in the wet on identical tread.
- Type (summer, all-season, winter): compound temperature windows. Winter rubber wins below about 7 °C and on snow, and gives some back on hot dry tarmac.
- Compound (economy to track): the grip class within a type. Track rubber stops shortest and wears fastest.
- Terrain category (PC, HT, AT, MT, RT): the pattern family. Aggressive off-road blocks buy mud traction with on-road wet grip.
- Pattern direction (symmetrical, directional, asymmetrical): how the tread moves standing water out of the contact patch.
- Size and width: wider grips more in the dry, floats earlier in standing water.
- Pressure: costs grip in both directions away from the placard figure, and low pressure lowers the speed where hydroplaning starts. Our PSI guide covers what to run.
The conditions
- Weather (dry to flooded): sets the water film from 0 to 8 mm. Past about 2.5 mm of standing water, hydroplaning becomes possible and grip can vanish entirely.
- Surface (25 of them): new asphalt to polished ice, each with its own peak grip and locked-slide grip.
- Temperature: moves each compound into or out of its working window.
- Slope: downhill adds distance, uphill takes it away.
The vehicle and the driving
- Vehicle and weight: heavier pushes the tyres past their best grip. Pick a preset or type the exact kerb weight.
- Trailer: an unbraked trailer is mass with no brakes of its own. Braked trailers carry their share.
- ABS on or off: peak grip against locked-and-sliding. 35 metres against 42 from 80 km/h in the wet, and with ABS you can still steer.
- Brake fade (0 to 10): hot brakes after repeated hard stops grab less.
- Wind: a headwind helps, a tailwind hurts, a crosswind unsettles.
The pedals and the planner
- Foot down (10 to 100%): how much of the throttle a manual press uses, from a light squeeze to flat out.
- Hold speed: locks the current speed like cruise control until you brake. Press H on a keyboard. The throttle will not break the hold; only the brake or the button does.
- The run sentence: accelerate gently, normally or flat out, up to a speed or for a number of seconds, then brake, cruise or coast. Watch it plays the run out; Results only computes it instantly through the same physics.
- The run log: every stage of every run in plain language, with times, distances and rates. Runs stack above a divider so you can read two back to back.
The reference tableStopping distances at a glance
Straight from the simulator's engine: an average grade C tyre with new tread on a 1,500 kg car with ABS, level road, 20 °C, and a 1.5 second reaction. Wet is a 1 mm water film, the depth used in official EU wet braking tests.
| Speed | Reaction | Braking, dry | Total, dry | Braking, wet | Total, wet |
|---|---|---|---|---|---|
| 50 km/h | 20.8 m | 13.0 m | 33.8 m | 17.3 m | 38.1 m |
| 60 km/h | 25.0 m | 18.2 m | 43.2 m | 22.6 m | 47.6 m |
| 70 km/h | 29.2 m | 24.0 m | 53.2 m | 28.6 m | 57.7 m |
| 80 km/h | 33.3 m | 30.5 m | 63.8 m | 35.1 m | 68.4 m |
| 90 km/h | 37.5 m | 35.2 m | 72.7 m | 39.7 m | 77.2 m |
| 100 km/h | 41.7 m | 40.0 m | 81.7 m | 44.7 m | 86.4 m |
| 110 km/h | 45.8 m | 47.1 m | 92.9 m | 53.3 m | 99.2 m |
These are the tool's own numbers for one fixed setup, so you can check them against the simulator above. Change the tyre, the load or the surface and they move, which is the point of the tool.
The evidenceThe research and method behind it
The engine is classical braking physics: distance from speed and effective friction, with the friction built factor by factor from named sources. It is not tuned to look dramatic. It is scored against 974 published braking tests, and for each one it is given the conditions and asked to predict the measured stopping distance without seeing it.
What that looks like, row by row. Six of the 974, picked across surfaces, with the current engine's prediction against the published measurement:
| Source | Test | Conditions | Measured | Engine predicts | Error |
|---|---|---|---|---|---|
| ADAC 2024 Summer | Top-rated Continental, grade A | Wet, 80→20 km/h | 27.8 m | 27.9 m | +0.4% |
| Auto Bild 52-Tyre 2024 | Continental PC7, best dry | Dry, 100→0 km/h | 33.9 m | 35.5 m | +4.7% |
| Vi Bilägare 2024 Nordic | Goodyear UltraGrip Ice 3, −7.5 °C | Snow, 35→5 km/h | 12.4 m | 12.3 m | −1.0% |
| ADAC Winter 2024 | Winter tyre on ice | Ice, 50→0 km/h | 66.0 m | 59.5 m | −9.8% |
| Discount Tire study | Worn to 2 mm, near the legal limit | Wet, 97→0 km/h | 63.4 m | 60.6 m | −4.4% |
| Car and Driver 2024 | BMW iX, 2,510 kg EV | Dry, 97→0 km/h | 35.4 m | 34.6 m | −2.3% |
Every row in the corpus carries this detail plus the source reference, so any of the 974 can be looked up and checked. A prediction passes inside a tolerance matched to test-to-test noise, 15% for most sources; across the whole corpus the engine passes 848 of 871 testable benchmarks (97.4%), with dry at 99%, wet 97%, snow 95% and ice 95%.
The biggest contributors are the programmes serious drivers already trust: ADAC, Auto Bild, TÜV SÜD, Tekniikan Maailma, Vi Bilägare, Car and Driver, TyreReviews and Continental's Contidrom tread programme, plus NZ skid-resistance work in NZTA Research Reports 293, 244 and 382.
The full write-up lives on the research and methodology page: the model equation by equation, the corpus and where every test came from, the audit of excluded tests, the per-surface accuracy table, and how to request the data and rerun the score yourself. The corpus and scoring script are supplied on request to journalists and researchers.
Common questionsFAQ
How far does it take to stop from 100 km/h?
For an average grade C tyre with new tread on a 1,500 kg car with ABS: about 82 metres dry and 86 metres wet, including 42 metres covered during a 1.5 second reaction before the brakes bite. A worn or low-grade tyre adds car lengths on top. Run your own setup in the simulator above.
How accurate is the simulator?
848 of 871 testable benchmarks land within tolerance of the published measured distance, 97.4%, with a mean error of 6.5%. The benchmarks are 974 catalogued braking tests from 218 named sources. The full breakdown by surface, and what a pass means, is on the research page.
How much further does it take to stop in the rain?
On a good tyre, not much: wet braking from 80 km/h takes about 5 metres more than dry. The gap explodes as the tyre gets worse. Worn to the legal minimum, wet braking is 46% longer than on new tread. Rain punishes bad tyres far more than good ones, which is why the wet grip grade exists.
What is the difference between braking distance and stopping distance?
Braking distance runs from the moment the brakes bite to the moment the car stops. Stopping distance adds the reaction first: at 100 km/h a typical 1.5 second reaction covers 42 metres before the car slows at all. The simulator reports the two separately so you can see which one your tyres can actually fix.
Does the EU wet grip grade really matter?
Yes, because it is measured, not marketing. The grade comes from instrumented wet braking tests under EU Regulation 2020/740. In the simulator, wet braking from 80 km/h takes 31 metres on a grade A tyre and 43 metres on a grade E. That is a 39% gap, about three car lengths, from the letter on the label.
How much does tread depth change stopping distance?
From 80 km/h in the wet, braking rises from 35 metres on new 8 mm tread to 51 metres at the 1.5 mm legal minimum, 46% longer. Tread barely matters in the dry; in the wet it is the whole game, because the grooves are what clear the water. See real worn tyres at every depth in our tread depth gallery.
Is 1.5 mm of tread legal in New Zealand?
Yes, 1.5 mm across principal grooves is the WoF minimum. Legal is not the same as safe: at 1.5 mm the simulator shows wet braking 46% longer than new tread, and most manufacturers suggest replacing at 3 mm because wet grip falls away steeply below that.
Do old tyres stop worse even with plenty of tread?
Yes. Rubber hardens with age and grips less, tread or no tread. In the simulator a 10 year old tyre takes 23% longer to brake in the wet than an identical new one. Find your tyre's age in seconds with the DOT date code decoder.
What does ABS actually do?
ABS holds the tyre at peak grip instead of locked and sliding on the rubber it is tearing off. From 80 km/h in the wet the simulator shows 35 metres with ABS against 42 metres locked, and with ABS you can still steer around what you are trying not to hit.
Why does speed matter so much?
Braking distance grows with the square of speed. Double the speed and braking roughly quadruples: in the wet, 17 metres from 50 km/h becomes 45 metres from 100 km/h on the same tyre. The energy the brakes must dump is what you feel as those extra metres.
Is this what my car would actually do?
It predicts typical instrumented-test behaviour for the setup you enter. Your road, your brakes and your reaction will differ. The tool is for comparing tyres and conditions fairly, not for certifying your car.
Does towing change my stopping distance?
Yes. An unbraked trailer is extra mass your car's brakes and four tyres must stop on their own. The simulator models trailer weight and trailer brakes; add yours in the vehicle settings and compare the runs with and without.
Does it work on a phone?
Yes. Hold the on-screen ACCELERATE and BRAKE buttons instead of the keyboard.